In reading applications, coverage corresponds to the number of reads that cover each base in the genome on average. Coverage can be calculated as:
Note that only the number of mapped reads should be included in the above calculation. The
recommended coverage for identifying genomic variants is 30X or more, while de novo assembly requires a much higher coverage. The ideal coverage in any given project depends on the purpose and design of the experiment. For example, when re-sequencing a population containing a variety of heterogenic genomes, the coverage must be higher for the robust detection of rare variants. Due to unequal read coverage in counting applications, such as RNA-Seq, there is no one formula for selecting the appropriate coverage for each project. In RNASeq, for instance, more highly expressed transcripts will receive higher coverage while lowly expressed transcripts will receive less coverage.
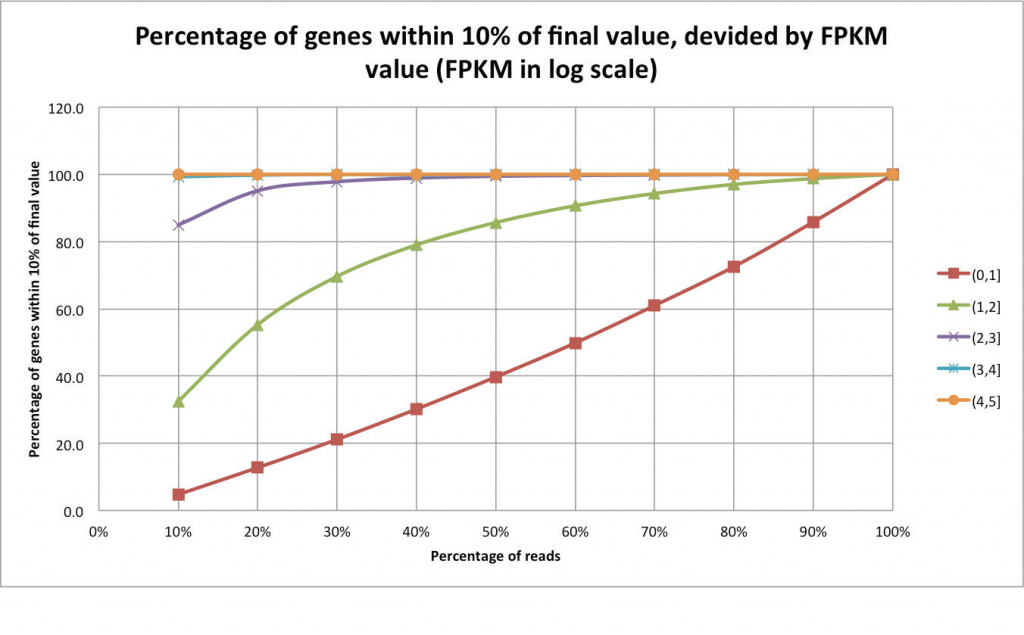
In these cases, it is recommended to evaluate transcriptomic complexity by beginning with a pilot experiment of just a few samples in order to assess what the ideal coverage for each individual application could be. An example of an analysis that can help assess whether enough reads have been sequenced is a “saturation report” (Figure 2). In this “jack-knifing” method, the expression levels are determined using all of the reads. The expression levels are then compared to those recalculated using only a fraction of the reads. Examining the expression levels at each cut of the data is useful for identifying the point at which expression level remains unchanged despite additional data. As expected, additional data is helpful in resolving expression levels of lowly expressed genes. After determining the number of reads required per sample, the samples are divided into lanes according to the number of sequenced reads per lane, which is a fixed amount.
Figure 2. Each series is a set of genes that differ in their final expression values using the complete dataset (in this case, 32 million reads). Highly expressed genes are saturated with as little as 10% of the reads, whereas lowly expressed genes require a higher amount of reads. Very lowly expressed genes remain unsaturated even with the complete dataset.
Figure and caption adapted from: “An introduction to high-throughput sequencing experiments: design and bioinformatics analysis,” by R. Normand and I. Yanai, 2013, Deep Sequencing Data Analysis, Methods in Molecular Biology, 1038, p. 1-26.


