ChIP-Seq is an application used to analyze protein-DNA interactions. It combines chromatin immunoprecipitation (ChIP) with high-throughput DNA sequencing to identify the binding sites of DNA-associated proteins such as histone modifications and transcription factors.
Researchers who request this service from the TGC receive the following analysis results files:
- Final report – detailed summary of the analysis, including explanations and statistics for each step, technical details, and all necessary information for publishing.
- Raw data – the sequenced reads in ‘fastq’ format.
- Genome viewer files – visualization of the aligned reads (bam and wig files), allowing further exploration of selected loci.
- Per-sample results table – contains the significantly enriched regions detected in each sample, with statistical analysis results.
- Saturation report – analysis to determine coverage sufficiency.
- Plots – visualization of the data.
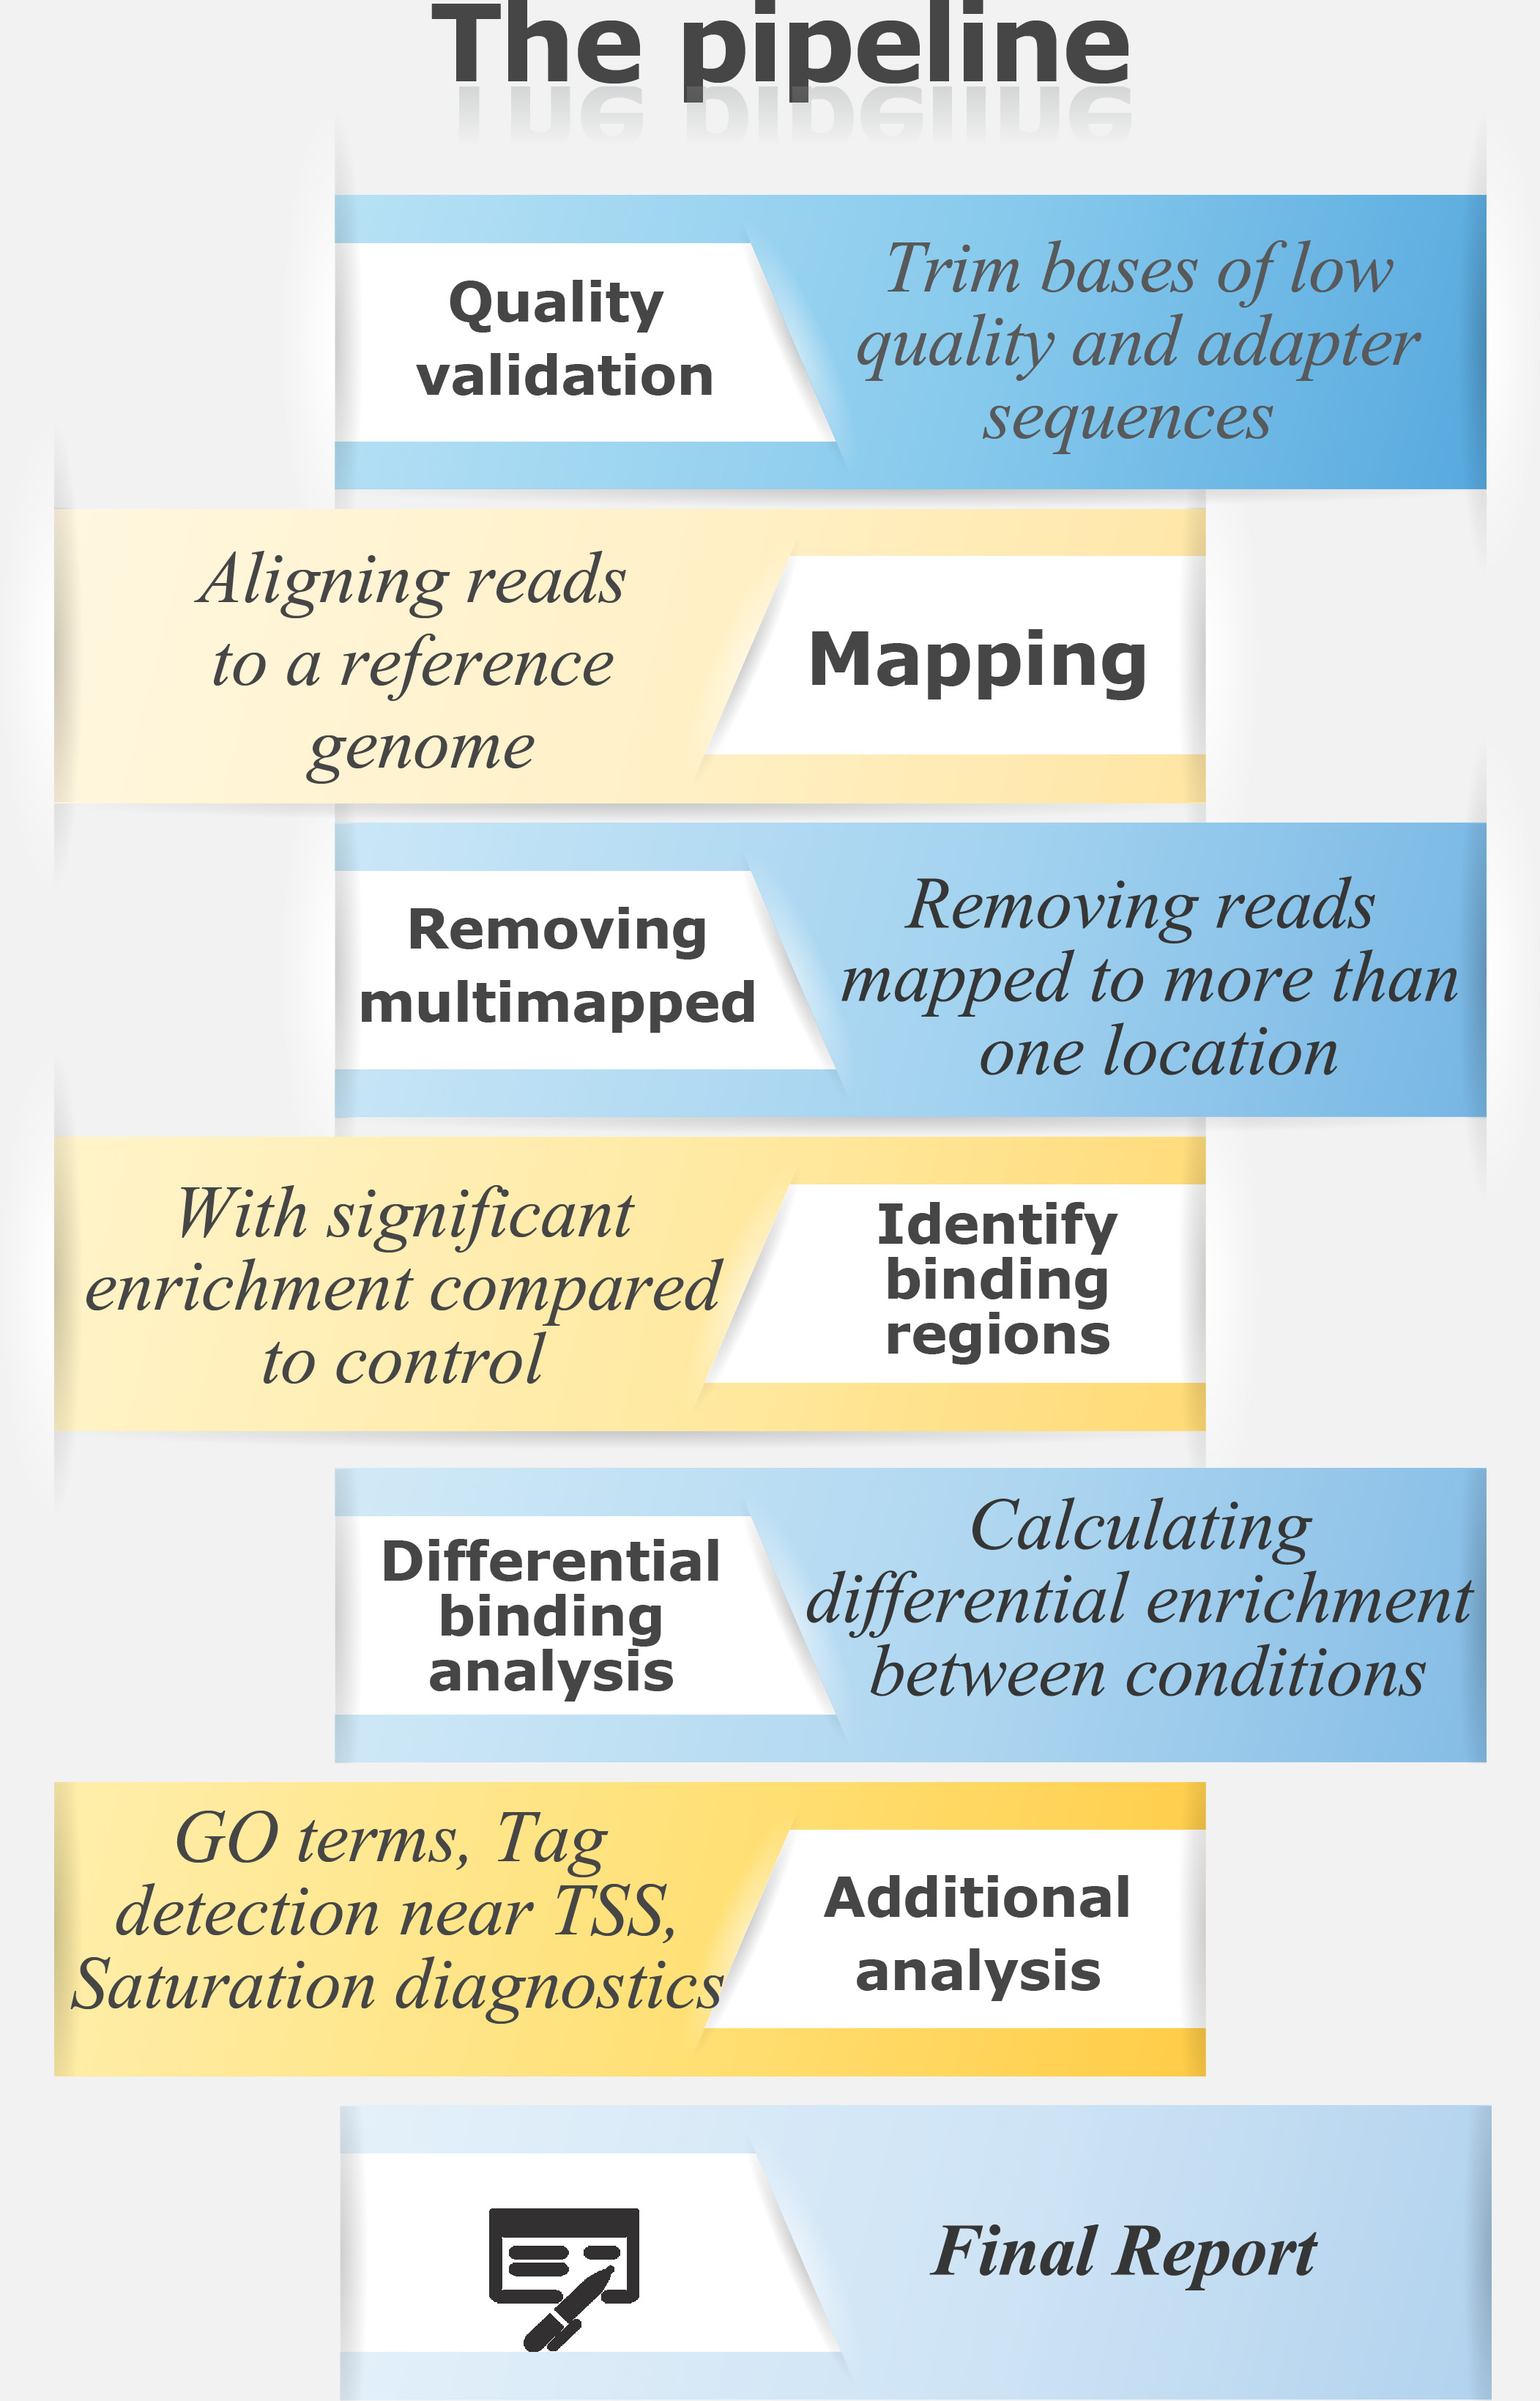
For a ChIP-Seq pipeline in text format
Examples of ChIP-Seq Data Visualization:
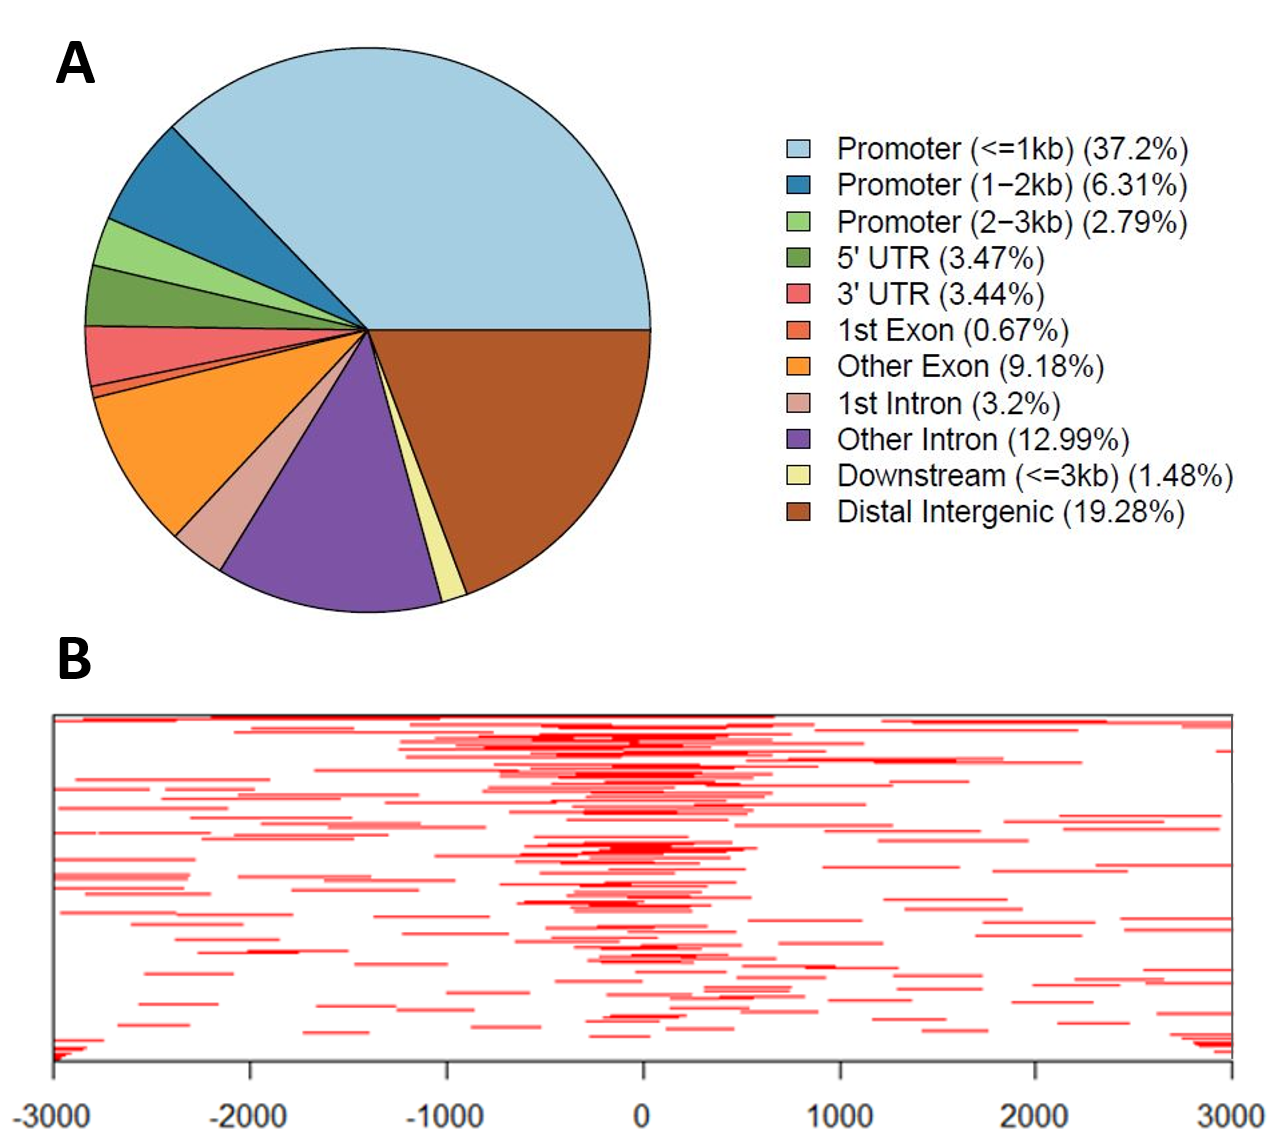
A: Genomic annotations pie chart – Genomic annotations of regions statistically enriched in ChIP-Seq data, including location distribution within the genome.
B: Heatmap of ChIP-Seq peaks binding to TSS (Transcription Start Site) regions