RNA sequencing (RNA-Seq) is a powerful method for profiling and quantifying gene expression at the RNA level. It is typically used to characterize and/or compare gene expression profiles under specific conditions, taking into account biological replicates. The method does not require species and transcript-specific probes, thus no previous knowledge regarding the nature of the transcriptome is required.
The method also enables variants discovery analysis.
Researchers who request this service from the TGC receive the following analysis results files:
- Final report – detailed summary of the analysis, including explanations and statistics for each step, technical details, and all necessary information for publishing.
- Raw data – sequenced reads in ‘fastq’ format.
- Genome viewer files – visualization of the aligned reads (bam files), allowing further exploration of specific loci of interest.
- An organized results table – contains normalized expression levels of each gene as well as statistical comparisons tailored to each experiment’s unique requirements.
- Plots – visualization of the data for the researcher’s convenience in the form of a PCA plot, heatmaps, and MA plots.
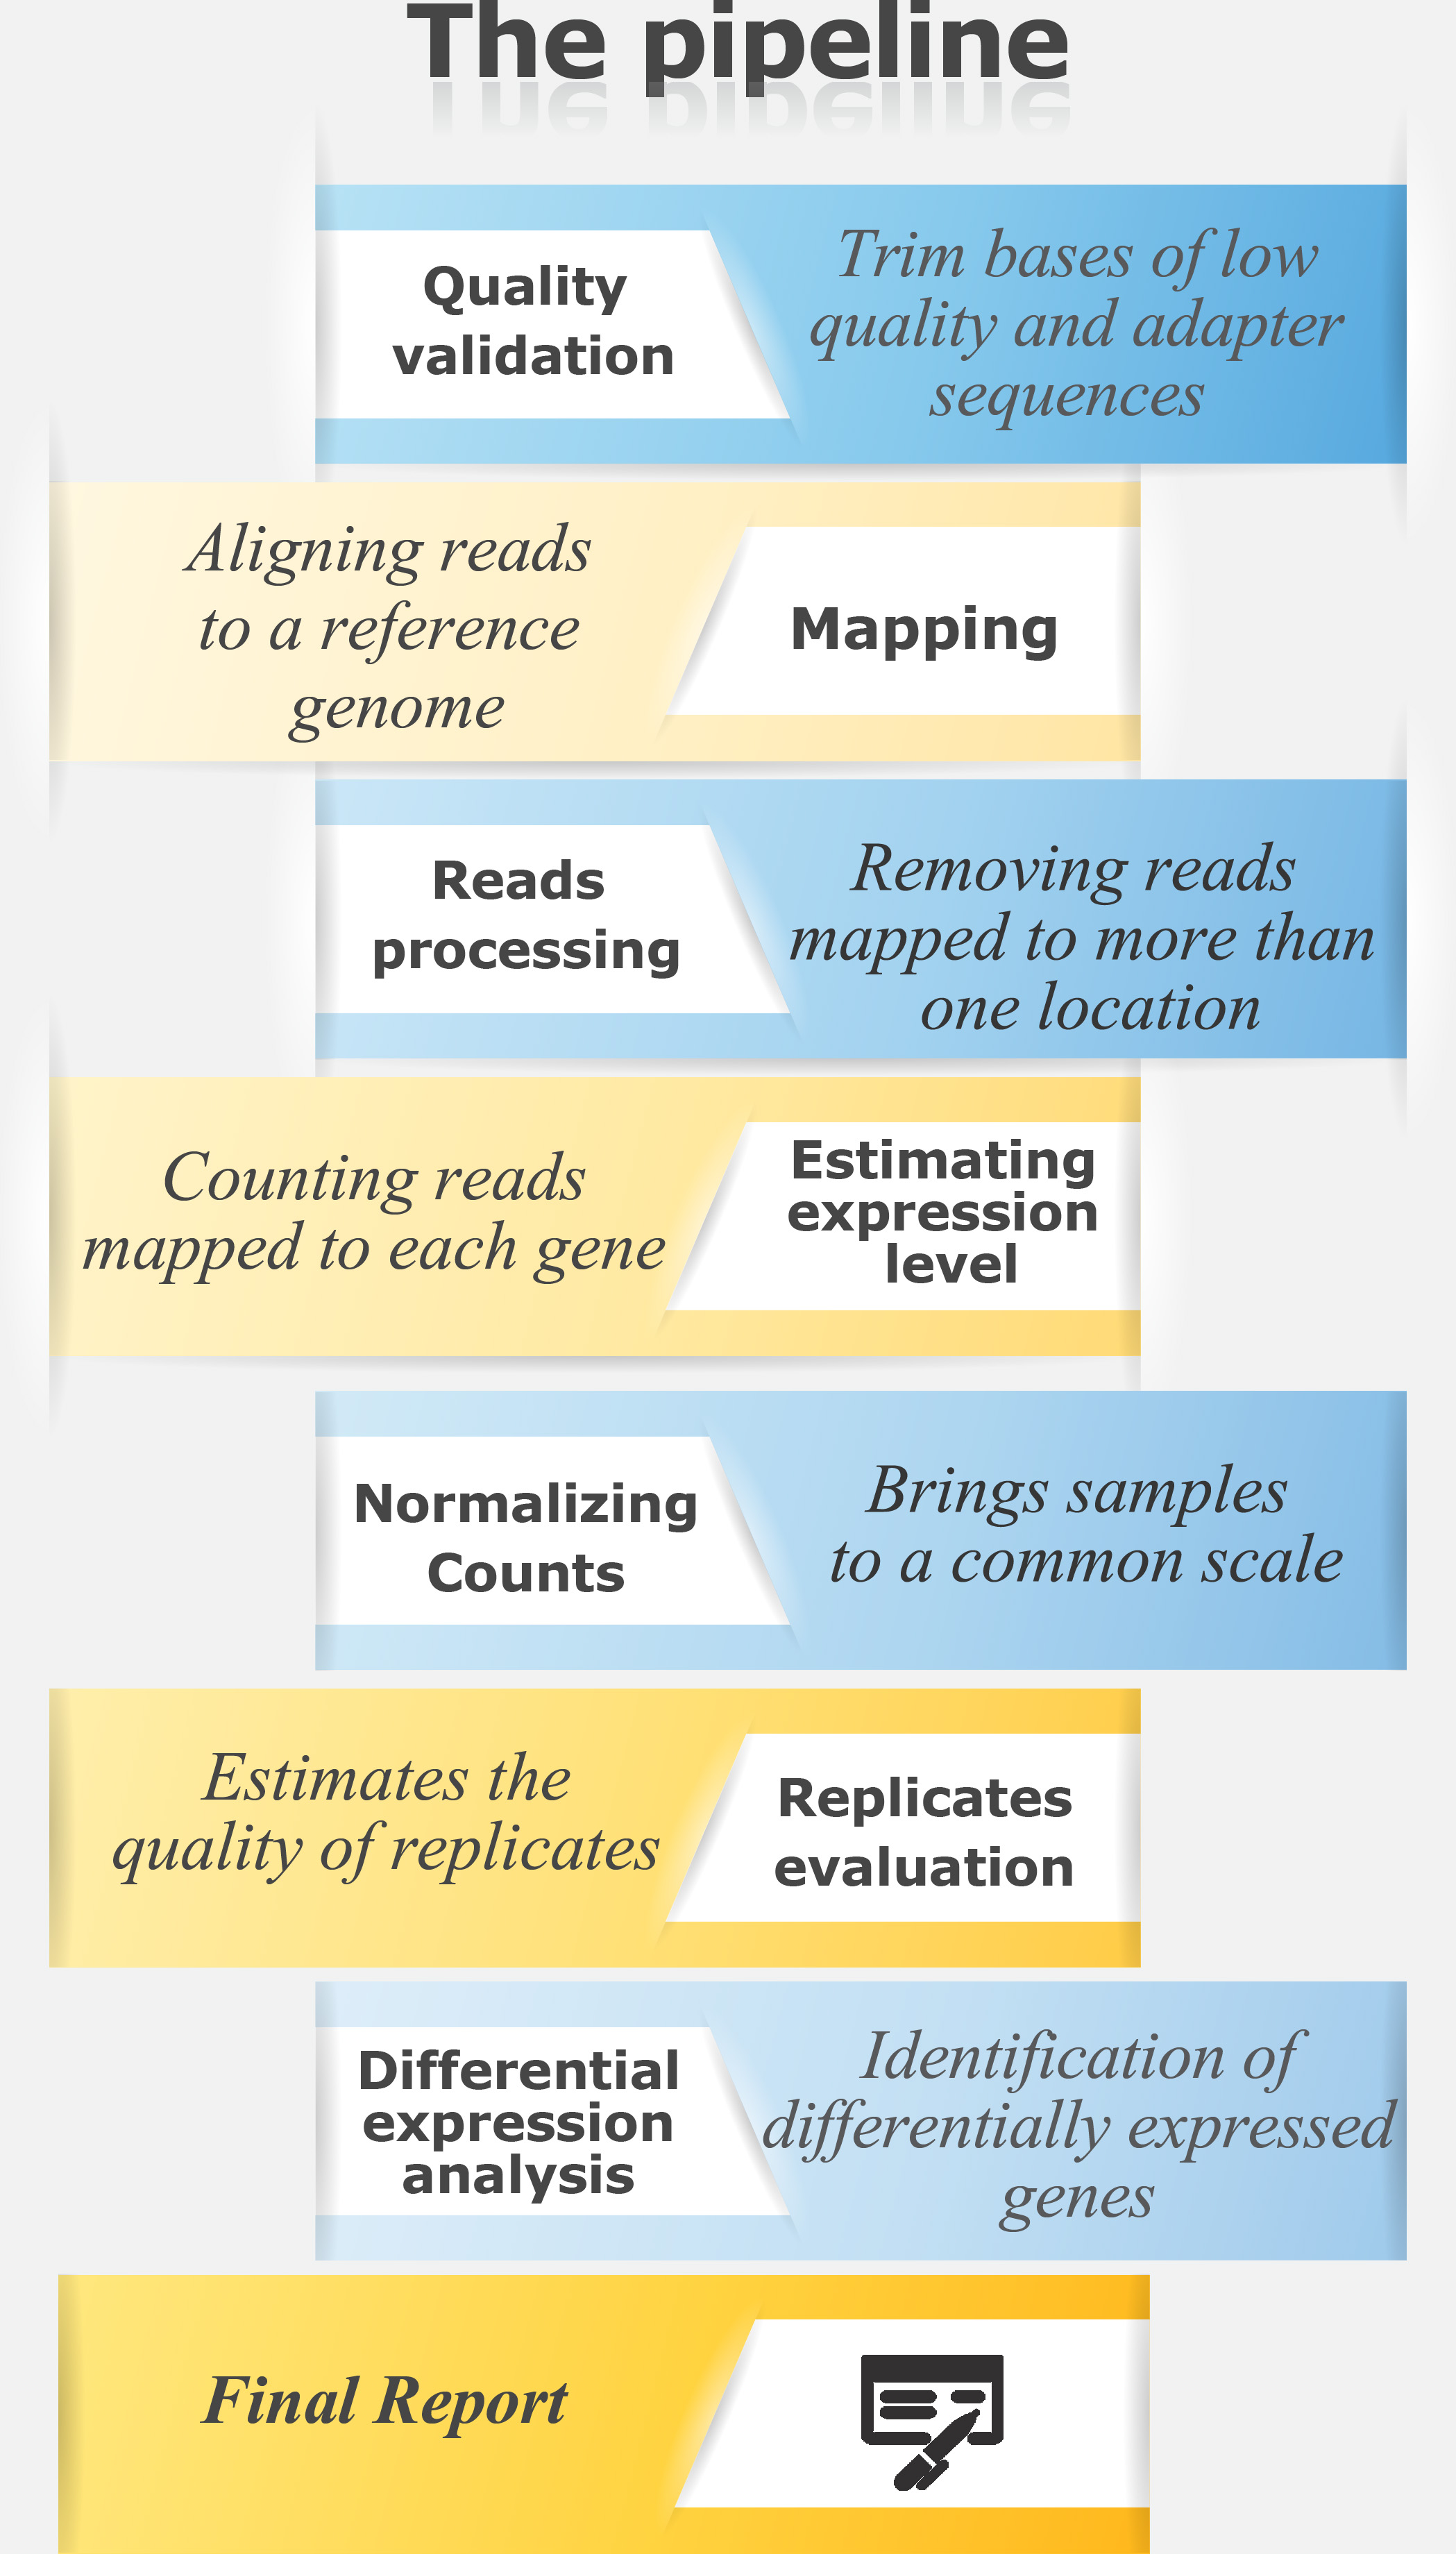
For RNA-seq pipeline in text format
Example of Results Table for Differential Gene Expression Analysis:
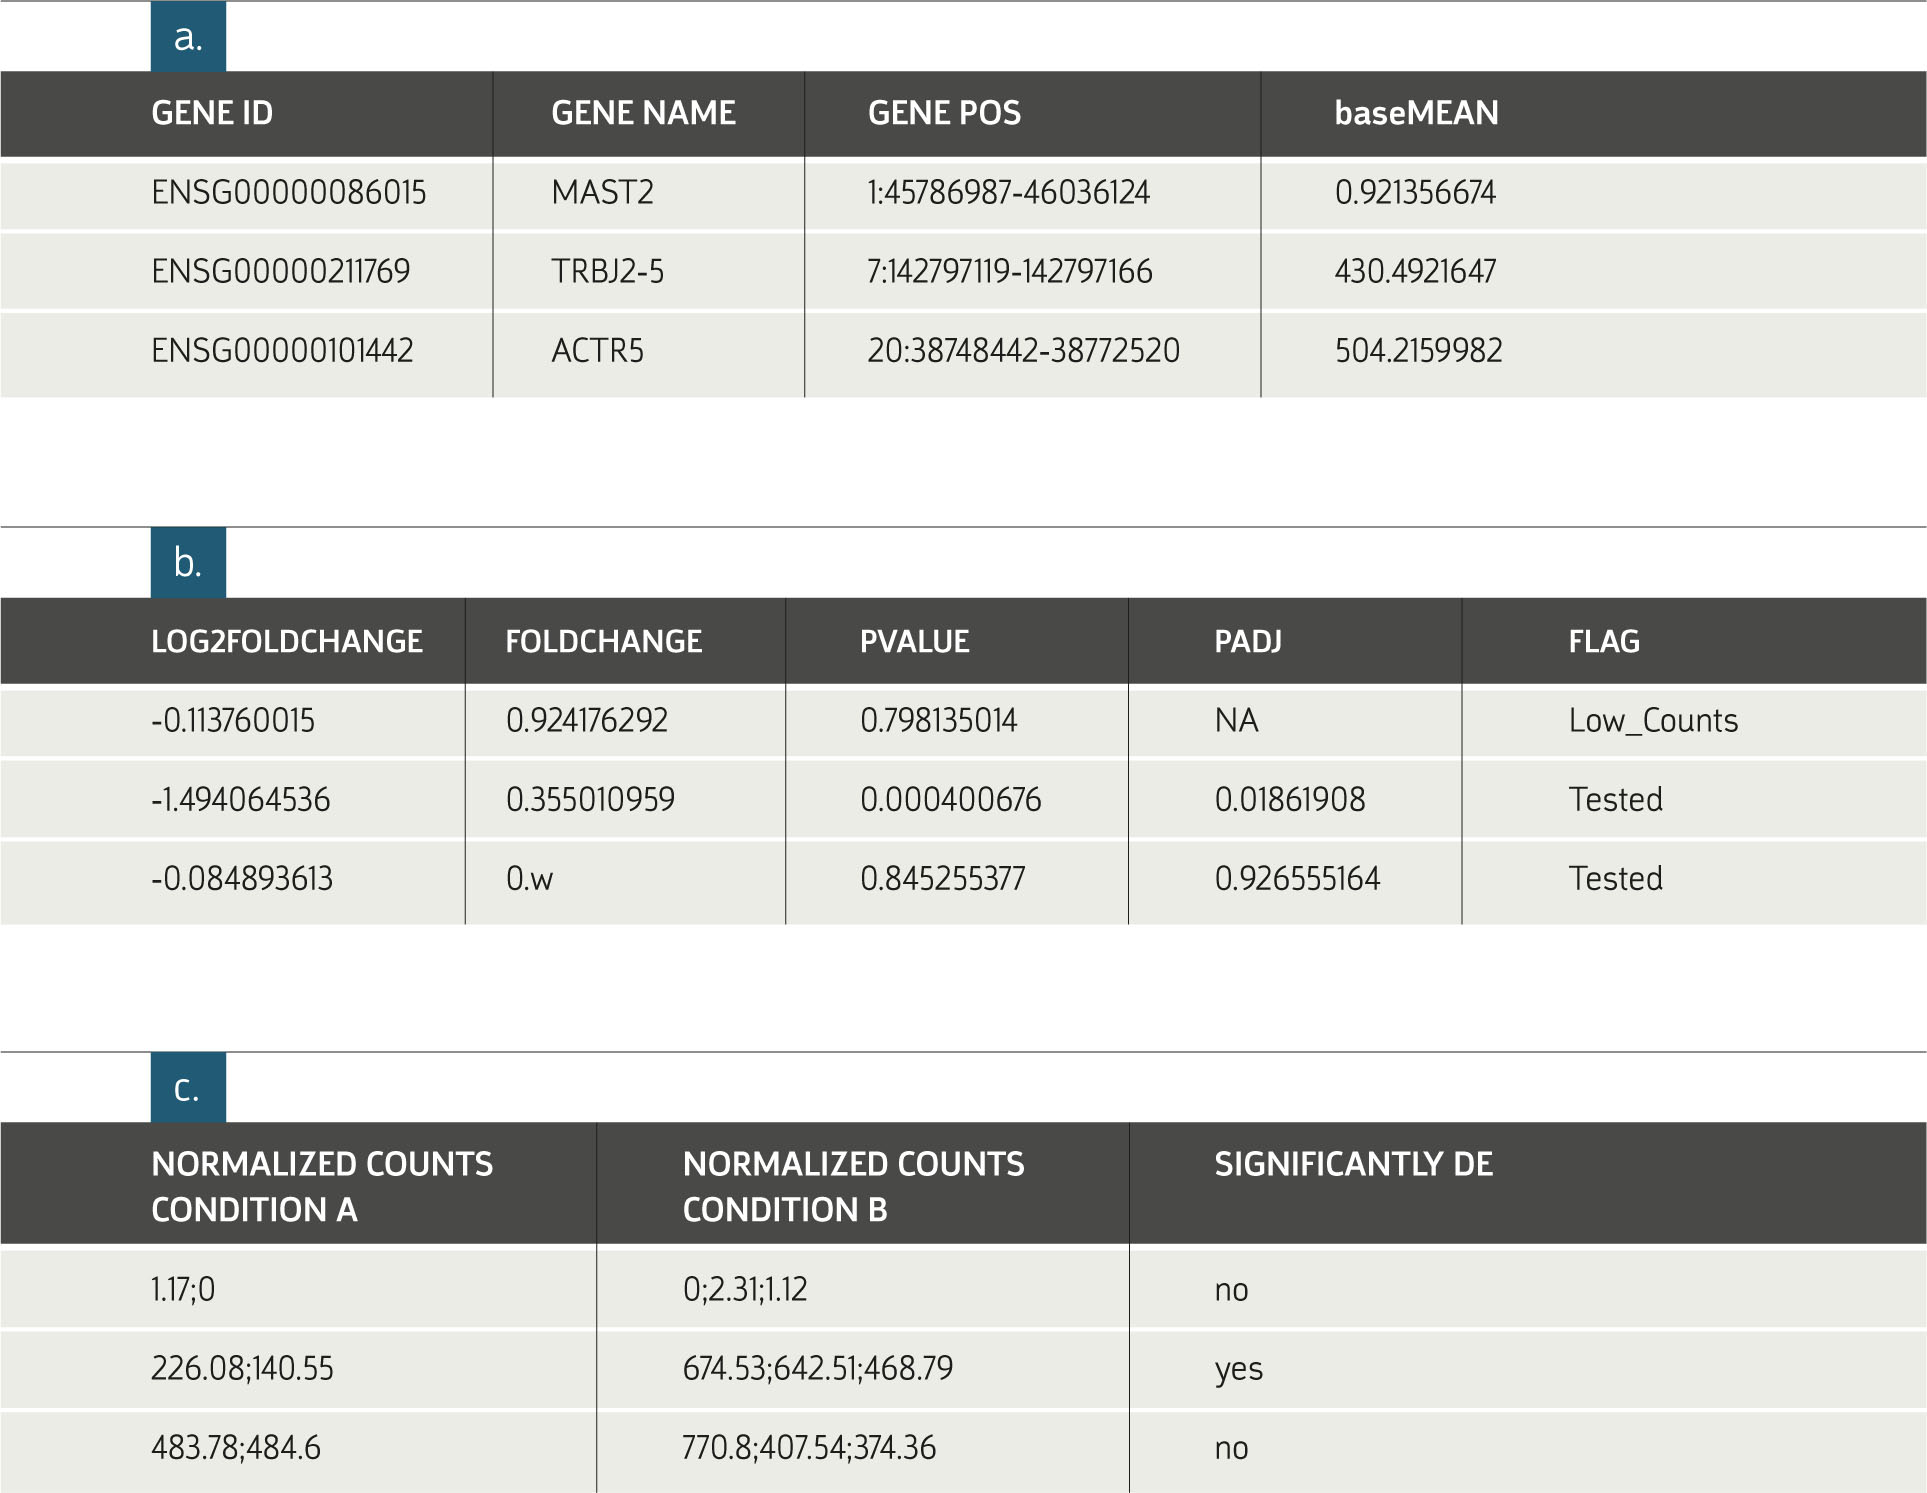
a. General information on each gene. The subjects displayed in this table depend on the
organism of interest. The information in figures b. and c. are provided for each requested
comparison between conditions.
b. Statistical results of the differential expression analysis.
c. The normalized expression levels of all samples relevant to each comparison are shown
in columns grouped according to replicate sets. An additional indicator, Significantly DE (Differentially expressed), is provided. This value is based on a minimal threshold on the adjusted p-values.
Examples of RNA-Seq Analysis Plots:
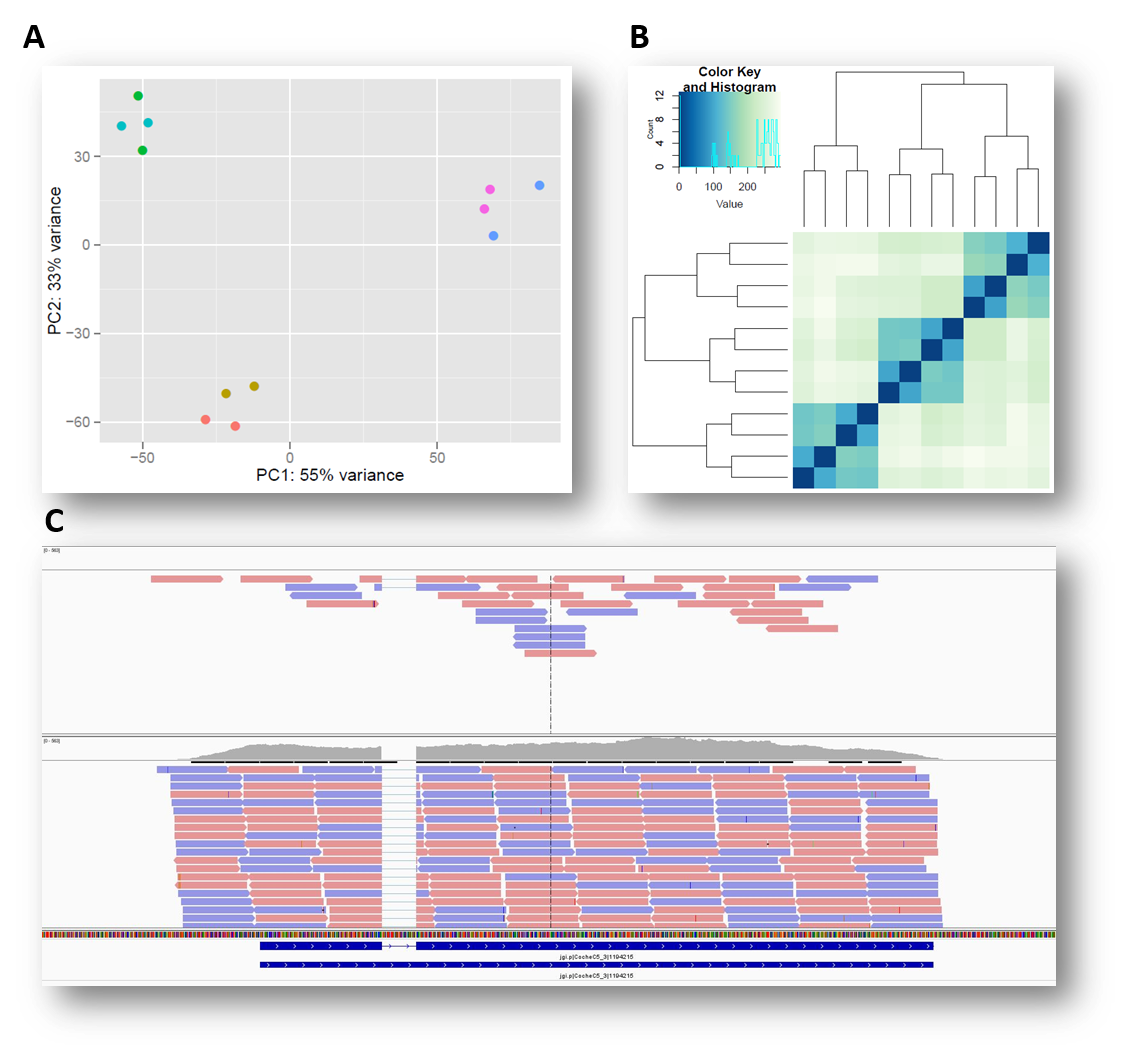
A: PCA plot – PCA analysis is performed in order to visualize and identify experimental covariates and batch effects. The plot spans the samples on a 2-dimensional space demonstrating sample-to-sample distances.
B: Euclidian distances heatmap – This plot allows the researcher to visually quantify similarities and differences between biological replicates and/or different samples under different biological conditions.
C: IGV (genome viewer) –A graphic representation of the mapping patterns of RNA-Seq reads to a reference genome. The example above depicts the mapping of two exonic regions of two different samples (–control sample above and treated sample below). The mapping allows the researcher to see that the gene of interest is up-regulated in the treated sample compared to the control.
Tutorial explains the results of the RNA sequence service provided by the TGC