Resequencing analysis identifies whole genome variations compared to a reference genome, such as SNPs, insertions and deletions. DNA variants are genotyped, annotated, and compared between samples.
Researchers who request this service from the TGC receive the following analysis results files:
- Final report – detailed summary of the analysis, including explanations and statistics for each step, technical details, and all necessary information for publishing.
- Raw data – sequenced reads in ‘fastq’ format.
- Genome viewer files – visualization of the aligned reads (bam files), allowing further exploration of coverage profiles and a broader view of selected variant loci.
- An organized results table – Includes detailed information on each variant found within each sample, including genomic annotations of the variant’s loci and project-specific filtering criteria.
- Coverage files– A list of low coverage regions and overall coverage profile details.
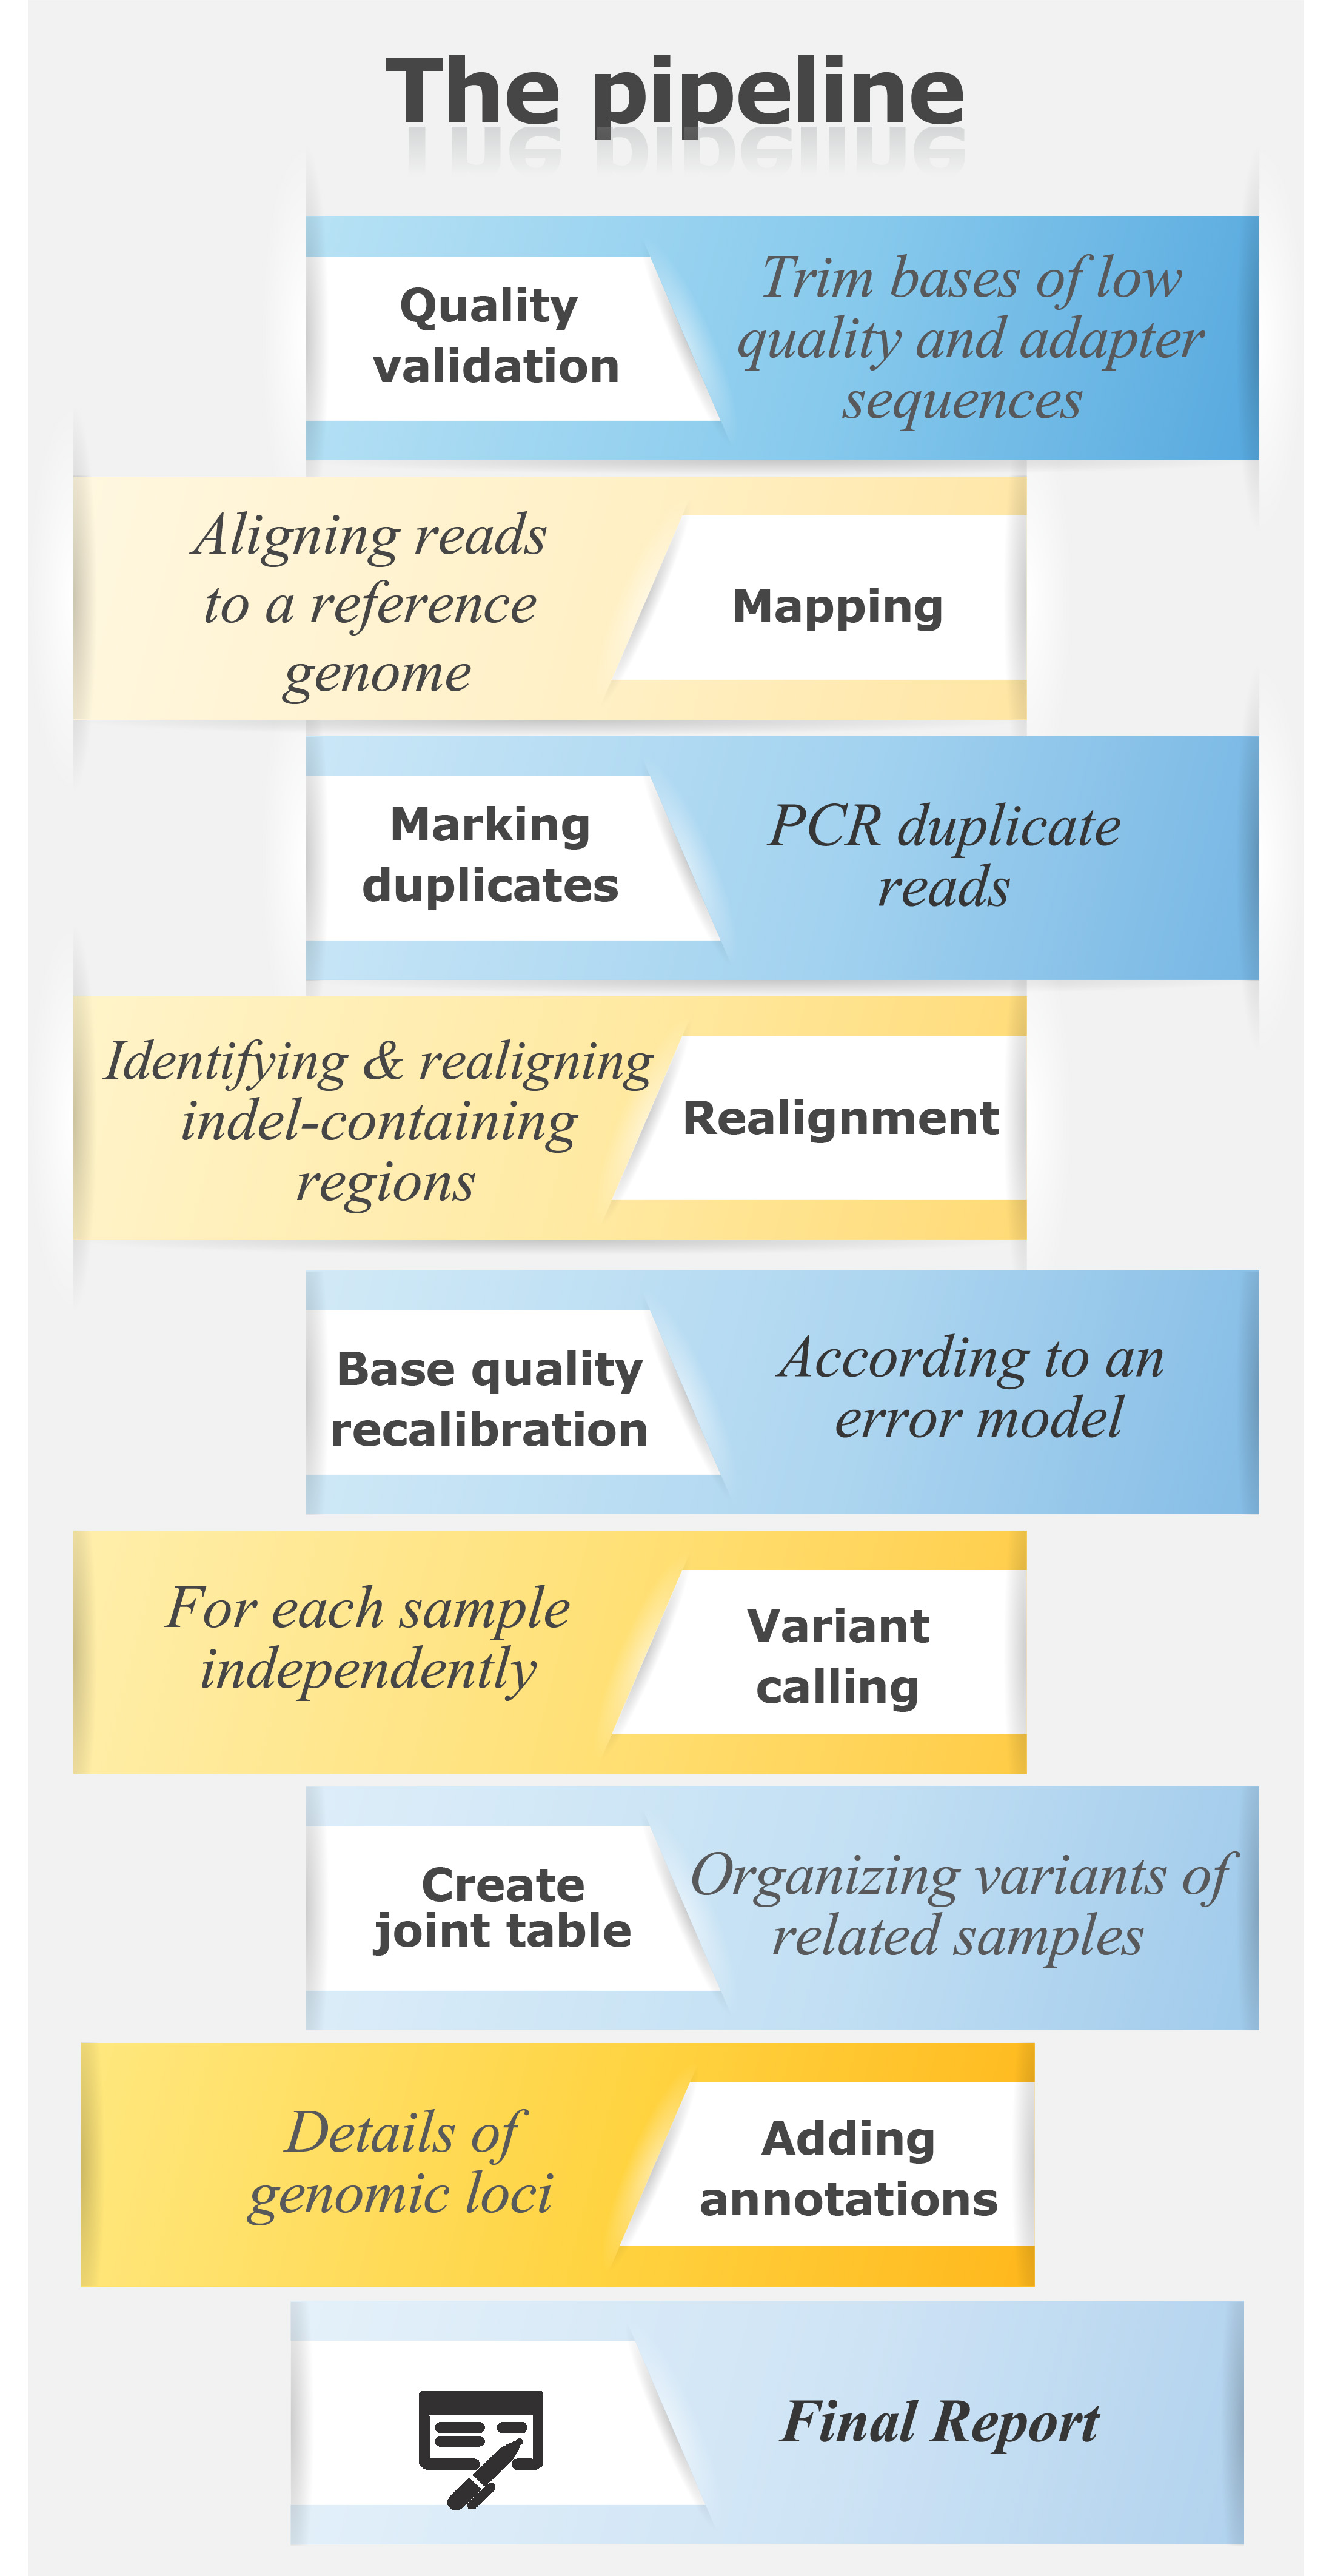
For a resequencing pipeline in text format
Example of a Resequencing Analysis Variants Table:
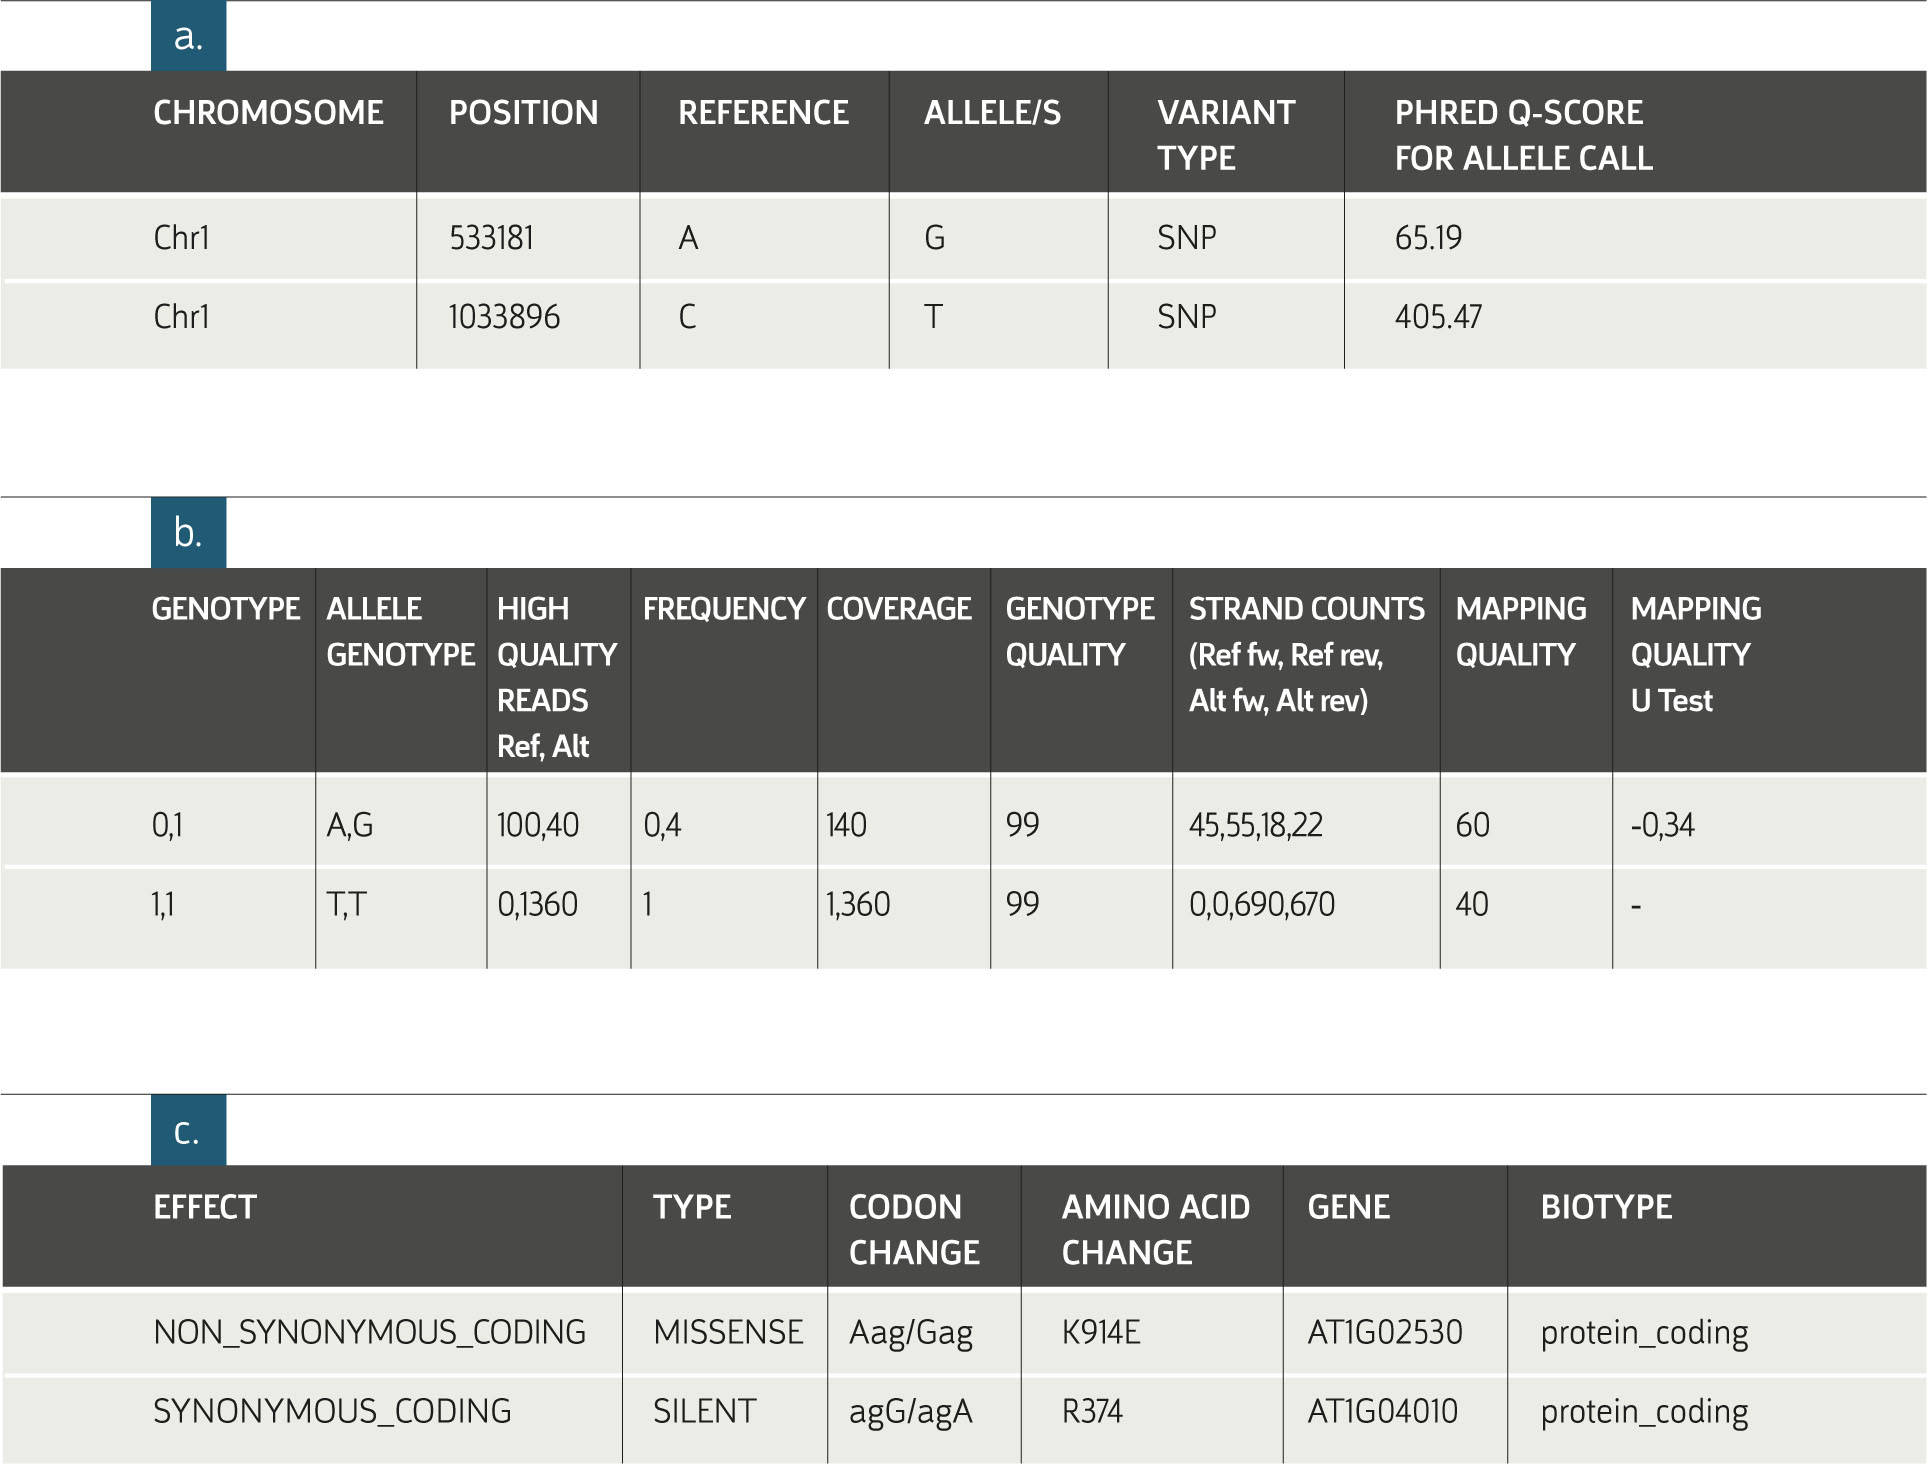
Reseq table
a. General information about the detected allele(s).
b. Sample-specific information. The columns pictured above appear in the table for each of the analyzed samples.
c. Genomic annotations of the variant position in the genome. The specific annotations provided in this table differ according to the organism’s database.
Heterozygous Locus Identified in Resequencing Analysis:
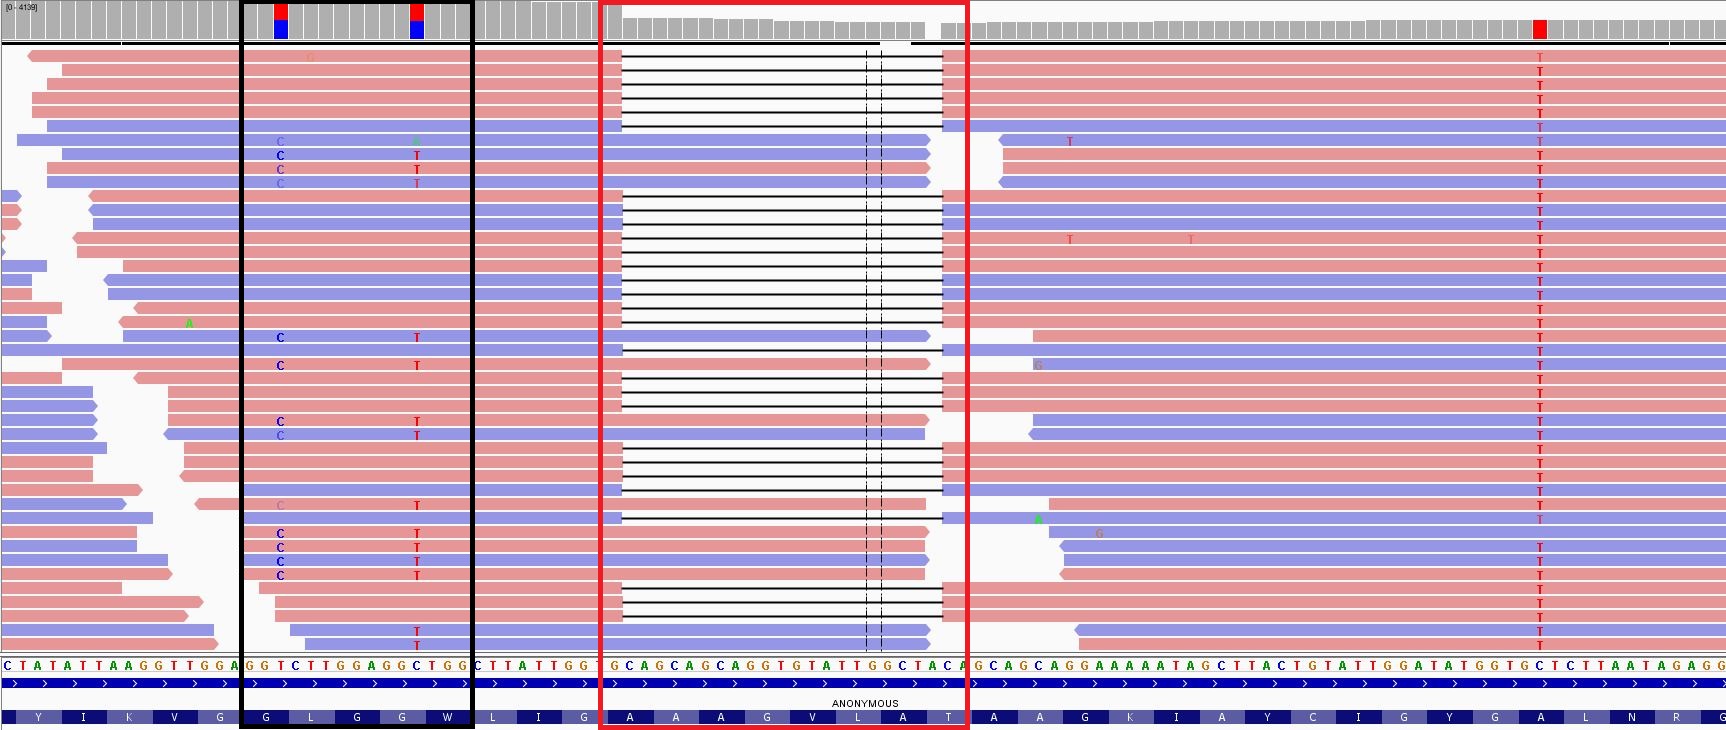
IGV (genome viewer) – Genome viewers, such as IGV, visually depict read alignment within the genome. In the figure above, two alleles within the pictured coding region were detected, containing either a deletion (outlined in red) or two Single Nucleotide Polymorphisms (SNPs) (outlined in black).